
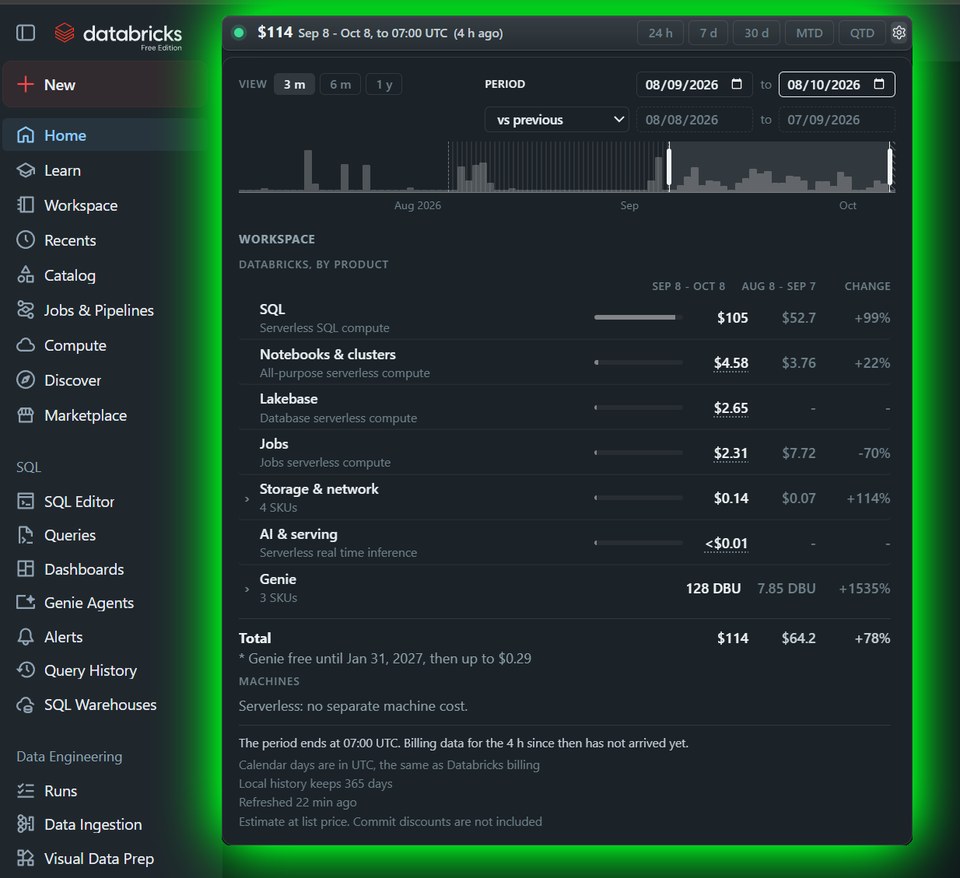
Workspace spend at a glance
The cost banner appears in the Databricks workspace interface. It summarizes the selected reporting period and gives you a quick way to open a broader view of workspace costs.
Open the cost details
The expanded view includes period controls, a cost chart and a cost-by-SKU breakdown. Use these details to compare activity across periods and decide which resource or workload to investigate next.
Explore FinOpsWay features
Check the reporting period
Choose from the available reporting windows, such as 24 hours, 7 days and 14 days. The displayed total applies to the selected window, so compare like-for-like periods when reviewing a change.
See when billing data is available
Databricks billing data is delayed. The banner and expanded view show the latest reported time and the end of the available window. Recent activity may not appear yet. Check the reporting period before treating the total as complete.
Estimates and billing limits
The banner is a cost monitoring view, not an invoice. Some cloud infrastructure amounts are estimates, and private contract terms or separately billed resources may affect your final bill. Read the cost calculation methodology for more detail.
Get started: Connect your workspace or explore all FinOpsWay features.
Add FinOpsWay to your browser
Install the free extension from your browser’s store. No FinOpsWay account is required.
 Available forGoogle ChromeGet the extension
  Available forMicrosoft EdgeGet the extension
  Available forMozilla FirefoxGet the extension
 Microsoft Edge uses the Chrome Web Store listing.